Looking into the crystal ball
In mid-October of last year, at approximately the same time that Red Sox designated hitter David Ortiz was busy blasting an eighth-inning grand slam to spearhead a wild 6-5 ALCS comeback win for the Red Sox over the Detroit Tigers, the Washington Redskins were in Dallas for a Week 6 Sunday night showdown with the Cowboys. When the final whistle blew at AT&T Stadium on October 13, the Redskins had outgained the Cowboys 433-213 in total net yardage, but had lost a lopsided affair by the score of 31-16.
There were several factors that contributed to the Cowboys’ convincing victory despite the fact that the team had been outgained in total yardage by more than a 2 to 1 ratio. Dwayne Harris returned a punt 86 yards for a score in the second quarter and then ran a kickoff back 90 yards to the Washington 15-yard line midway through the third quarter, which resulted in a 15-yard touchdown pass from quarterback Tony Romo to wide receiver Terrance Williams two plays later. Those two sequences resulted in 14 points on the scoreboard for the Cowboys, yet only 15 total yards of offense in the box score. Conversely, during the fourth quarter, Robert Griffin III and the Washington offense marched 63 yards down the field to the Dallas 23-yard line before an untimely interception gave the ball back to the Cowboys.
 ICONRomo and the Cowboys defeated the Redskins by 15 points despite being outgained by 220 yards of offense.
The Cowboys’ victory over the Redskins on that Sunday night in October was more a case study in efficiency than it was a demonstration of the offensive firepower that has overwhelmed the National Football League over the last few years. Dallas took advantage of every opportunity afforded to them by the Redskins and turned just 213 total yards of offense into 31 points, while Washington stalled repeatedly when it mattered and finished the contest with just 16 points after tallying a staggering 433 yards of offense. The Cowboys exited their Week 6 showdown with the Redskins having scored one point for every 6.87 yards of offense. Washington, on the other hand, needed 27.06 yards for every point the club put on the scoreboard.
While certainly not a novel statistic, yards per point (YPP) is an efficiency metric that has some predictive value in helping to determine which teams are poised for a regression and which are set to take a big step forward. A team doesn’t need to rank in the top-five in total offense or scoring in order to produce a respectable YPP, but they do need to make the most of their opportunities and cash in when the time arises. The Baltimore Ravens ranked a pedestrian 16th in the NFL in total offense in 2012, but went on to win the Super Bowl thanks, in some small part, to a YPP of 14.33 (8th in NFL).
Along those same lines, a franchise can shoot the lights out marching up and down the field, but it winds up meaning very little if the team has nothing to show for all the effort. The Detroit Lions ranked sixth in the NFL in total offense last season, but produced a YPP of just 15.88 (23rd in the NFL), turned in a final record of 7-9 and fired head coach Jim Schwartz. The Lions’ problem wasn’t moving the football, it was moving the football efficiently.
Despite its relative obscurity within the mainstream media, YPP has a cult-like following among specific circles—notably, in Las Vegas—because of its ability to tell a detailed story with just one concise number. In the example mentioned at the beginning of this column, YPP demonstrates that the Cowboys got a big effort from their special teams unit, forced a crucial turnover on defense and made the requisite amount of plays necessary on offense to take advantage of a short field in the team’s 31-16 win over Washington. YPP also serves to highlight just how bad the Dallas defense was in 2013 when, despite a YPP of 12.43 (second in NFL), the Cowboys finished just 8-8 and missed out on the postseason.
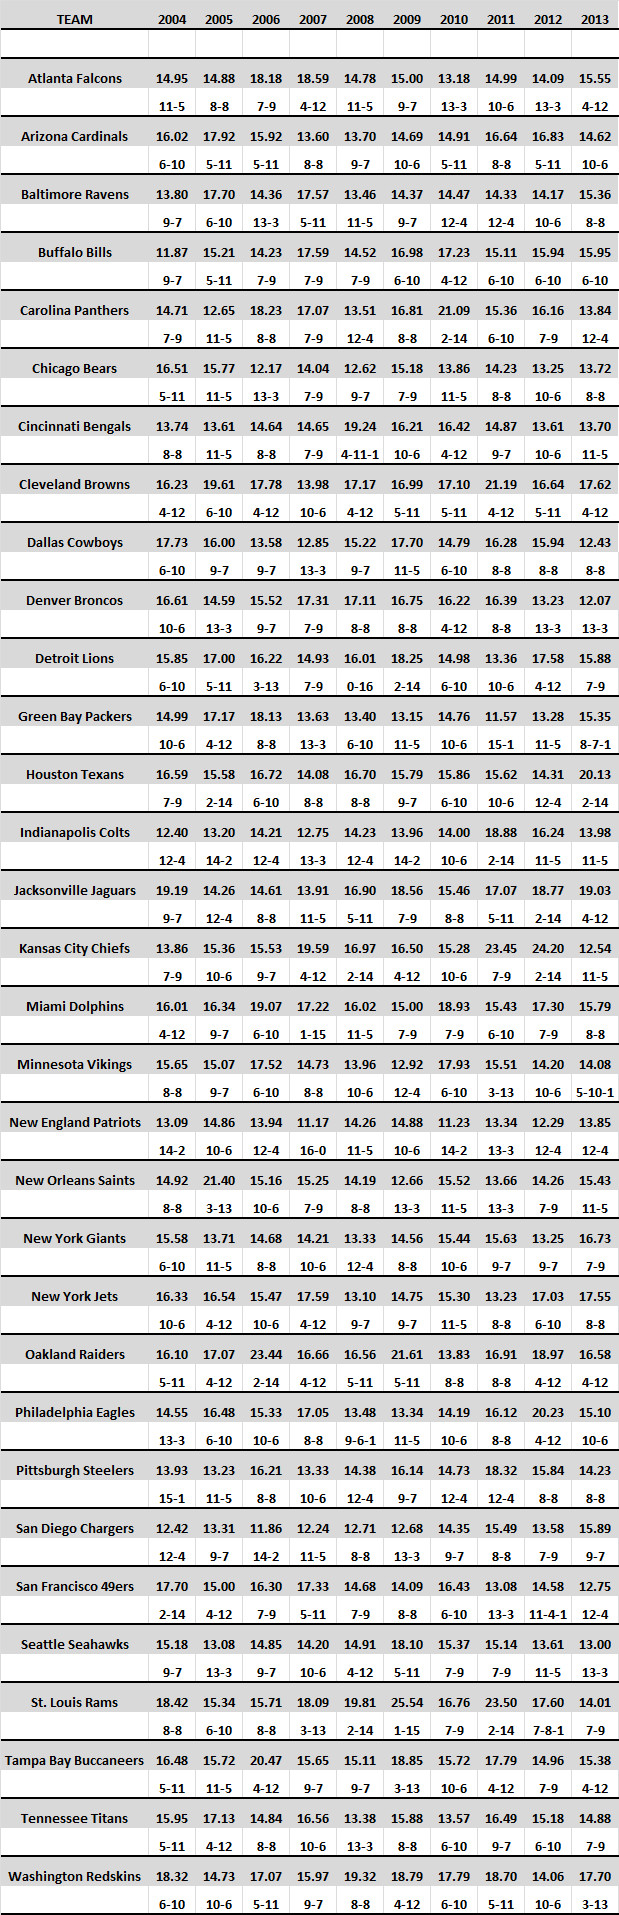
Like in golf, the goal when it comes to YPP (total yards divided by total points) is to produce the lowest number possible. Let’s take a look at a breakdown of every team’s YPP over the last ten years (complete chart located at end of story) to determine what constitutes success and what constitutes failure.
Aggregate YPP data for each team from 2004-2013
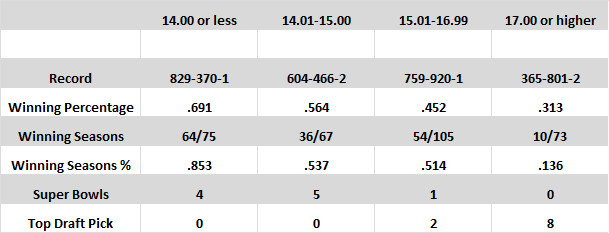
Since 2004, there have been 75 instances in which a team finished the regular season with a YPP of 14.00 or less. Those 75 instances have produced a combined winning percentage of nearly 70 percent, 64 winning seasons (85.3 percent) and four Super Bowls. This, ladies and gentlemen, is the category in which you want your team to appear.
On the opposite end of the spectrum reside the 73 instances since 2004 in which a team posted a YPP of 17.00 or higher. Those 73 instances resulted in a combined winning percentage of just .313, 63 losing seasons (86.4 percent), zero Super Bowls and eight first overall draft choices the following spring. These are the highly inefficient teams that consistently comprise the bottom of the divisional standings.
As the above chart demonstrates, the lower the YPP a team can generate, the greater the chance of success that club will have during the season. This should surprise exactly none of you. But what just may grab your attention is what happens the year after a team posts a YPP of 14.00 or lower or 17.00 or higher.
From 2004-2012, there were 65 instances in which a team finished the regular season with a YPP of 14.00 or lower. In 44 of those instances (67.6 percent), the team posting a YPP of 14.00 or lower won fewer games the following year, with an average regression of 3.52 wins per season. Take the 2011 Detroit Lions as an example, who went 10-6 with a YPP of 13.36. In 2012, the Lions regressed to a 4-12 club with a YPP of 17.58.
On the other end of the equation were 68 instances of a franchise recording a YPP of 17.00 or higher from 2004-2012. In 44 of those instances (64.7 percent) the team posting a YPP of 17.00 or higher won more games the following year, with an average increase of 4.06 wins per season. We’ll use the 2005 Baltimore Ravens as our example this time, who went 6-10 with a YPP of 17.70 before coming back in 2006 to notch a 13-3 record with a YPP of 14.36.
Reasons for the change in course following a season with either a YPP of 14.00 or lower or 17.00 or higher vary from coaching and personnel adjustments to increased emphasis on problematic areas. If a team posts a YPP of 19.55 one year, you can bet that franchise’s front office will work to identify and remedy the issue through free agency and the draft. Conversely, one reason a drop-off occurs for clubs recording YPPs of 14.00 or lower is that in most instances, this is simply too great a pace to maintain. Of the 320 seasons (32 teams x ten years) documented in this study, a YPP of 14.00 or lower has occurred only 75 times (23.4 percent), so you can begin to see the difficulty in maintaining such stellar results from one season to the next.
While there are never any guarantees when it comes to the world of professional sports, it’s usually worth the effort to pay attention to a trend that predicts either progress or regression in approximately two out of every three instances. Here’s a rundown of the NFL teams who posted a YPP of 14.00 or lower or 17.00 or higher in 2013.
BOUNCING BACK
Cleveland Browns: The perennial bottom dwellers of the AFC North posted a YPP of 17.62 last season en route to a 4 -12 record and the franchise’s sixth consecutive losing season. However, while this study shows that teams who post a YPP of 17.00 or higher bounce back the following season 64.7 percent of the time, there’s cause for concern here. Star wide receiver Josh Gordon has been suspended for the entire 2014 season, current starting quarterback Brian Hoyer is coming back from a serious ACL injury and backup signal-caller Johnny Manziel looked exactly as you would expect a rookie to look during the preseason. Despite a better-than-average defense, five wins could be a stretch here.
 Take it to the bank that J.J. Watt and the Texans will find more success in 2014 than they did last year.
Houston Texans: This squad is absolutely rebounding from last year’s pathetic 2-14 campaign that featured a 14-game losing streak. Turnover machine Matt Schaub is gone, head coach Gary Kubiak has been replaced by Bill O’Brien and stud pass rusher Jadeveon Clowney was added via the first pick in the draft. Houston’s 20.13 YPP in 2013 ranked dead last in the NFL last season, so there’s really nowhere to go but up.
Jacksonville Jaguars: Head coach Gus Bradley has something cooking in Jacksonville, as evidenced by the team’s resilient 4-4 run to close out the 2013 campaign. But a rookie quarterback in Blake Bortles along with rookie receivers in the form of Marqise Lee and Allen Robinson should lead to more growing pains as the Jaguars work their way back to respectability. As an aside, we aren’t the only ones expecting another step forward from the Jags this season. After opening the team’s season win total at 4.5 games, many Las Vegas sports books have been forced to adjust that number to 5.0 due to “over” money that has come in to support the boys from Florida.
New York Jets: The YPP metric points to progress for a Jets team that went 8-8 last season, but this club was the most overachieving team in football last year. A 9-7 record for the Green looks out of the question when you examine some of the other popular metrics used to predict season outcomes, most notably Pythagorean wins.
Washington Redskins: Mike Shanahan has been replaced by Jay Gruden and Pro Bowl receiver DeSean Jackson was added to an already potent offensive attack. The keys, of course, will come down to the Washington defense and quarterback RG3’s ability to stay healthy for a full 16-game season. Still, after a 3-13 season which featured a YPP of 17.70 (30th in NFL), the ‘Skins look ripe to rebound.
Improvement predictions: Houston (2-14), Jacksonville (4-12), Washington (3-13)
HEADED FOR REGRESSION
Carolina Panthers: A YPP of 13.84 (best since 2008) resulted in a 12-4 season, divisional title and trip to the playoffs for the first time since 2008. But approximately 53 percent of quarterback Cam Newton’s completed passes from the 2013 campaign departed for other cities during the offseason. In addition, Carolina has plenty of question marks at the running back position and along the offensive line in the wake of Pro Bowl left tackle Jordan Gross’ retirement. The Panthers’ defense is still one of the nastiest units in football, but how effective can they be if they’re on the field for 35 minutes a game?
Chicago Bears: The Bears posted a YPP of 13.25 in 2012 en route to a 10-6 record under former head coach Lovie Smith and regressed to an 8-8 team under Marc Trestman last season. But in the process, Chicago checked in under 14.00 once again (13.72) and now finds themselves in this category for the second consecutive year. We know the Bears can put up the points in their new offensive system (27.8 pts/gm, second in NFL), but the question is whether or not the defense was upgraded enough during the offseason to set the offense up with more short field opportunities. Assuming quarterback Jay Cutler can stay healthy and upright for the majority of the season, we don’t see this team taking a step back in 2014.
Cincinnati Bengals: The Bengals have notched a YPP of less than 14.00 four times over the last ten years, but have exactly zero playoff wins to show for the effort. Both coordinators from last season jumped ship to take HC jobs, as did defensive end Michael Johnson, who wound up signing with the Tampa Bay Buccaneers. Is it possible newly-minted quarterback Andy Dalton can lead this franchise to a second consecutive 11-win season?
Dallas Cowboys: As mentioned above, the Cowboys ranked second in the NFL in YPP last season (12.43), but won only eight games thanks to the league’s worst defense. Pass rusher DeMarcus Ware is now in Denver and star middle linebacker Sean Lee is out for the season with a knee injury. Offensively, quarterback Tony Romo is 34-years-old and coming off both a December back surgery and a year in which he posted his lowest completion percentage since 2009. Good luck finding anybody out there willing to state that eight wins isn’t a stretch for this club.
Denver Broncos: The 2013 league leader in YPP (12.07), the Broncos are coming off a historic season in which the team averaged a record-setting 37.9 points per game. Perhaps Denver’s YPP takes a dip in 2014, but it’s hard to envision a team quarterbacked by Peyton Manning coming apart at the seams.
Indianapolis Colts: Virtually every metric available pointed to a Colts regression in 2013, yet the franchise posted an 11-5 record and trip to the postseason for the second consecutive year. Playing in the softest division in football certainly helps Indy’s chances for a third straight trip to the playoffs, but things get off to an interesting start with a Week 1 showdown at Denver.
 Andy Reid and Alex Smith don't have the luxury of a soft schedule this season.
Kansas City Chiefs: Romeo Crennel gets the boot, Andy Reid steps in and a 2-14 squad turns into an 11-5 playoff team in less than a year. But Reid and the Chiefs won’t have the benefit of playing one of the NFL’s softest schedules this year like they did last and won’t sneak up on anybody after last season’s dramatic turnaround. Remember, for all the talk about how good this defense was last season, the Chiefs still got torched for an average of 27.7 points per game over their final seven contests (2-5 record).
New England Patriots: Over the last ten years, Tom Brady and the Patriots have posted a sub-14.00 YPP seven times with four regressions. But with Darrelle Revis in the mix on defense, Rob Gronkowski back in the fold on offense and young receivers Aaron Dobson and Kenbrell Thompkins ready to step their games up, it’s hard to imagine New England regressing much from last season’s 12-4 effort.
San Francisco 49ers: Beset by injuries on both sides of the ball while playing in the league’s toughest division, the Niners will have to lean heavily on the newly-paid right arm of quarterback Colin Kaepernick to navigate their way back to the playoffs this season. This isn’t the only metric pointing to a San Francisco regression in 2014 and it’s also worth noting that the current Vegas season win total on Jim Harbaugh’s crew is 10.5 with the under heavily juiced at -165.
Seattle Seahawks: Seattle’s dominant Super Bowl run featured a YPP of 13.00 (fifth in NFL) and a regular season record of 13-3, good for the top seed in the NFC. I’ve said it before and I’ll say it again: The Seahawks have the most lethal home field advantage in all of professional sports, so it’s difficult to picture this team going any worse than 6-2 at CenturyLink Field this season. Perhaps Seattle doesn’t get back to 13-3, but this team will still be in the thick of it come December.
Regression predictions: Carolina (12-4), Cincinnati (11-5), Dallas (8-8), Kansas City (11-5), San Francisco (12-4)
YPP date for each team from 2004-2013
Hit me up on Twitter: @JoeFortenbaugh
